What 756 Million Social Media Profiles Reveal About Americans Adapting Under Economic Pressure
Introduction
Socialprofiler stores 5 billion social media profiles and 2 trillion connections between them (follows) in our database from four major platforms: Facebook, TikTok, Instagram, and X, out of which more than 756M profiles and 113B connections belong to U.S. users in total across all networks. For each network, the same amount of users were fully analyzed to produce this article.
Our state-of-the-art patented technology detects 350,000+ unique interests from broad to very specific; it’s hundreds of times more unique interests than any social media network itself, and therefore our data is much more insightful.
We utilized data from Facebook, TikTok, Instagram, and X, and you can see both how users’ interests vary from platform to platform and an aggregated picture, representing the entire user base of all major social media in the U.S.
This report is built based on the entire U.S. population and cross-checked against all social networks.
This report presents a comprehensive analysis of generational differences in social media engagement patterns, based on data collected from major platforms, including Instagram and X (formerly Twitter).
This report analyzes affordability in America using social-graph correlations and age-indexed interest distributions derived from Socialprofiler data.
Rather than relying on surveys about what people say they believe, this approach observes what interests coexist within the same people—housing aspirations, credit recovery behavior, consumption adaptation, and lifestyle compromise—based on social media followings across major platforms.
The result is not a story of “winners vs. losers,” but of a middle class navigating a constrained system: working harder, optimizing more, and stretching longer to access what used to be “normal” economic life.
Where applicable, the report includes:
- Audience correlation analysis (overlap between category audiences)
- Age index analysis (which ages are over- or under-represented in an audience versus baseline)
- Segment intersection analysis (what the overlap group is interested in)
- Graph analysis (clusters and intersection zones)
Key Findings
- Side hustles are not a Gen Z gig trend—they peak at ages 46–60, signaling a midlife affordability crisis.
- Ages 36–45 show simultaneous credit repair + real estate education + down payment behavior: homeownership has become a marathon.
- Vanlife in 2026 is less escapism than a housing strategy for ages 30–45 priced out of ownership.
- Minimalism now contains two realities at once: chosen simplicity and enforced constraint.
- Second-hand consumption peaks mid-career, signaling middle-class optimization—not temporary student frugality.
- “Healthy living” and ultra-processed food interests coexist in the same people, indicating cost-driven compromise inside self-improvement culture.
- Credit repair has become a mainstream bridge between survival and aspiration—the central node of the affordability system.
- By age 50, Americans don’t choose between working more and spending less—they do both.
Context Observation
Affordability is often discussed as a youth or early-career problem. The data indicates something different: many affordability strategies today are intensified in midlife, when housing, family costs, and financial recovery intersect.
The signal is not collapse. It is continuous negotiation—a middle class forced to manage aspiration and constraint simultaneously.
Section 1: Credit Repair Is the Central Node of the Affordability System
1.1 Short Summary
Credit repair is no longer a niche interest for distressed borrowers. It appears as a structural phase of middle-class life—a bridge between survival and the hope of entering the housing market.
1.2 Hypothesis
If affordability pressure is structural, then credit repair should function less like an “emergency category” and more like a central routing mechanism connecting multiple life strategies: recovery, aspiration, and optimization.
1.3 Evidence and Analysis
Credit repair is the most connected housing-adjacent node in the social graph and correlates strongly with:
- Real estate education and investment communities (e.g., BiggerPockets)
- FIRE / financial independence ecosystems
- Airbnb hosts and income strategy clusters
Its strongest age concentration appears between 36–45, aligning with:
- active learning about real estate
- saving for a first down payment
- simultaneous debt and credit score management
[Table 1: Credit Repair Audience Correlations]
| idx | cat1 | cat2 | network | corr_cats |
|---|---|---|---|---|
| 81 | Credit repair | BiggerPockets | 0.235993 | |
| 286 | Credit repair | Home cooking | 0.044945 | |
| 4 | Credit repair | Luxury Fashion | 0.040170 | |
| 80 | Credit repair | Couponing | 0.036791 | |
| 82 | Credit repair | Airbnb Hosts | 0.034192 | |
| 76 | Credit repair | DIY repairs | 0.026593 | |
| 147 | Credit repair | FIRE | 0.025901 | |
| 158 | Credit repair | Side hustles | 0.022728 | |
| 265 | Credit repair | VanLife/Nomad | 0.015251 | |
| 199 | Credit repair | Ultra-processed food | 0.010969 | |
| 299 | Credit repair | Meal prep | 0.009248 |
Method: Audience correlation analysis. Audiences are defined as followers of multiple bloggers in a category (Instagram), then correlation coefficients measure overlap.
Central correlation signal:
- Credit repair ↔ BiggerPockets: 0.236 (strongest link in the dataset)
[Table 2: BiggerPockets (Real Estate Education) Audience Correlations]
| idx | cat1 | cat2 | network | corr_cats |
|---|---|---|---|---|
| 81 | BiggerPockets | Credit repair | 0.235993 | |
| 84 | BiggerPockets | Airbnb Hosts | 0.123340 | |
| 148 | BiggerPockets | FIRE | 0.064989 | |
| 5 | BiggerPockets | Luxury Fashion | 0.054753 | |
| 287 | BiggerPockets | Home cooking | 0.054174 | |
| 77 | BiggerPockets | DIY repairs | 0.048425 | |
| 266 | BiggerPockets | VanLife/Nomad | 0.042247 | |
| 48 | BiggerPockets | Couponing | 0.028191 |
Confirmation of centrality:
- BiggerPockets ↔ Credit repair: 0.236 (strongest link again; validates the hub)
[Table 3: Distress Indicators - Payday Loans and Legal Aid Correlations]
| idx | cat1 | cat2 | network | corr_cats |
|---|---|---|---|---|
| 91 | Payday Loans | Credit repair | 0.001622 | |
| 86 | Payday Loans | Luxury Fashion | 0.000867 | |
| 21 | Payday Loans | Thrift/Secondhand | 0.000734 | |
| 98 | Payday Loans | Home cooking | 0.000507 |
Legal Aid connections:
| idx | cat1 | cat2 | network | corr_cats |
|---|---|---|---|---|
| 45 | Legal Aid | Home cooking | 0.002590 | |
| 194 | Legal Aid | Ultra-processed food | 0.002423 | |
| 40 | Legal Aid | BiggerPockets | 0.002127 | |
| 0 | Legal Aid | Luxury Fashion | 0.000919 |
Description:
Credit repair acts as the hub connecting:
- financial recovery (Payday Loans)
- wealth-building aspiration (BiggerPockets, FIRE, Airbnb Hosts)
- daily survival strategies (couponing, home cooking, DIY repairs)
Distress indicators (Payday Loans, Legal Aid) show weaker but present connections—suggesting the affordability system spans both recovery and aspiration, not one or the other.
1.4 Interpretation
Credit repair is not the end of a downward spiral. It functions more like the middle stage of a long attempt to regain access to “normal” economic life.
Section 2: Housing as a Zone of Overheating
2.1 Short Summary
In the data, mortgages do not represent stability. They mark a point of maximum financial strain, from which people diverge into multiple adaptation strategies.
2.2 Hypothesis
If housing is the primary affordability pressure point, then housing-related interests should consistently co-occur with:
- credit recovery behavior
- income supplementation
- aggressive cost optimization
- alternative living strategies
2.3 Evidence and Analysis
Housing-related interests (buying a house, real estate investment) consistently co-occur with:
- credit repair
- side hustles
- cost-optimization behavior bundles
Between ages 30–45, the data shows simultaneous growth in:
- attempts to push through ownership (credit repair + real estate education)
- alternatives to ownership (vanlife, house sharing)
[Table 4: Airbnb Hosts Audience Correlations]
| idx | cat1 | cat2 | network | corr_cats |
|---|---|---|---|---|
| 84 | Airbnb Hosts | BiggerPockets | 0.123340 | |
| 82 | Airbnb Hosts | Credit repair | 0.034192 | |
| 149 | Airbnb Hosts | FIRE | 0.033061 | |
| 273 | Airbnb Hosts | VanLife/Nomad | 0.015123 | |
| 9 | Airbnb Hosts | Luxury Fashion | 0.012198 | |
| 78 | Airbnb Hosts | DIY repairs | 0.011392 |
Airbnb Hosts connections (housing as income strategy):
- Airbnb Hosts ↔ BiggerPockets: 0.123 (strong link to real estate education)
- Airbnb Hosts ↔ Credit repair: 0.034
Description:
Airbnb hosting appears less like a casual side hustle and more like an extension of housing economics—connected to real estate education and independence strategies, reinforcing housing’s role as an income system, not just shelter.
2.4 Interpretation
Housing does not appear as a binary “rent vs. own” decision. It appears as a fractured trajectory where ownership is increasingly deferred, bypassed, or reimagined—often through hybrid strategies.
Section 3: Side Hustles Are About Retention, Not Mobility
3.1 Short Summary
Side hustles are not engines of upward mobility. They are mechanisms for maintaining a shrinking standard of living.
3.2 Hypothesis
If side hustles are affordability-driven, then they should peak where financial pressure is greatest—not where “gig culture” is most stereotypically assumed.
3.3 Evidence and Analysis
The highest concentration of side-hustle interest occurs at ages 46–60, not among young adults.
Method: Age index analysis. The audience share at each age is normalized against a random baseline group. Ratio >1 means over-indexed.
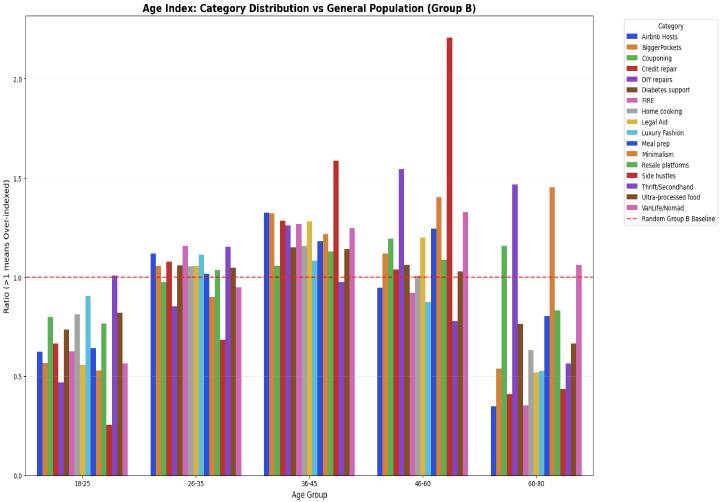
[Picture 1: Age Index for Affordability-Related Categories]
Key findings (high-signal peaks):
- Side hustles: peak 46–60 (ratio ~2.2) (strongest signal in dataset)
- Credit repair: peak 36–45 (~1.6)
- Thrift/Secondhand: peak 46–60 (~1.55)
- DIY repairs: peak 60–80 (~1.45)
- BiggerPockets: peak 46–60 (~1.4)
- VanLife/Nomad: rises from 36–45, remains elevated through 60–80
- Most categories under-indexed for 18–25
This confirms: affordability strategies are midlife phenomena, not youth trends.
[Table 5: Side Hustles Audience Correlations]
| idx | cat1 | cat2 | network | corr_cats |
|---|---|---|---|---|
| 158 | Side hustles | Credit repair | 0.022728 | |
| 159 | Side hustles | BiggerPockets | 0.014058 | |
| 154 | Side hustles | Couponing | 0.004722 | |
| 157 | Side hustles | DIY repairs | 0.002934 | |
| 167 | Side hustles | Home cooking | 0.002703 |
Side hustles connections:
- Side hustles ↔ Credit repair: 0.023 (strongest link)
Description:
Side hustles link statistically to:
- credit repair (recovery)
- real estate education (aspiration)
- survival strategies (couponing, DIY, home cooking)
No distinct “growth/entrepreneurship” cluster emerges. Side hustles appear embedded inside survival bundles.
3.4 Interpretation
This is not startup culture. It is midlife compensation under affordability pressure—retention behavior, not mobility.
Section 4: Minimalism and Second-Hand Consumption Are Adaptive, Not Ideological
4.1 Short Summary
Minimalism now bundles two realities: people who choose less—and people who cannot afford more.
4.2 Hypothesis
If affordability is structural, then “aesthetic” trends like minimalism should overlap with practical optimization behaviors, not exist separately as a lifestyle subculture.
4.3 Evidence and Analysis
Second-hand consumption peaks in mid-career at ages 36-45, not student years—indicating middle-class optimization, not temporary frugality.
Couponing, DIY, and home cooking form a stable optimization cluster.
[Table 6: Minimalism Audience Correlations]
| idx | cat1 | cat2 | network | corr_cats |
|---|---|---|---|---|
| 110 | Minimalism | FIRE | 0.033743 | |
| 107 | Minimalism | DIY repairs | 0.033445 | |
| 268 | Minimalism | VanLife/Nomad | 0.021910 | |
| 22 | Minimalism | Thrift/Secondhand | 0.021366 | |
| 105 | Minimalism | Couponing | 0.016763 | |
| 115 | Minimalism | Meal prep | 0.014988 | |
| 103 | Minimalism | Luxury Fashion | 0.013631 | |
| 114 | Minimalism | Home cooking | 0.011159 | |
| 109 | Minimalism | BiggerPockets | 0.006738 |
Minimalism connections:
- Minimalism ↔ FIRE: 0.034
[Table 7: FIRE (Financial Independence, Retire Early) Audience Correlations]
| idx | cat1 | cat2 | network | corr_cats |
|---|---|---|---|---|
| 148 | FIRE | BiggerPockets | 0.064989 | |
| 110 | FIRE | Minimalism | 0.033743 | |
| 149 | FIRE | Airbnb Hosts | 0.033061 | |
| 147 | FIRE | Credit repair | 0.025901 | |
| 144 | FIRE | Couponing | 0.022558 | |
| 6 | FIRE | Luxury Fashion | 0.020376 | |
| 269 | FIRE | VanLife/Nomad | 0.015749 | |
| 288 | FIRE | Home cooking | 0.012848 | |
| 301 | FIRE | Meal prep | 0.012781 | |
| 146 | FIRE | DIY repairs | 0.012562 | |
| 23 | FIRE | Thrift/Secondhand | 0.012429 | |
| 66 | FIRE | Resale platforms | 0.010057 | |
| 203 | FIRE | Ultra-processed food | 0.004004 |
FIRE connections:
- FIRE ↔ BiggerPockets: 0.065
Description:
Minimalism overlaps with FIRE, but both also connect to survival strategies. This indicates that “choice minimalism” and “constraint minimalism” are not separate audiences—they overlap heavily, rationalizing constraint in different cultural language.
4.4 Interpretation
Economic pressure is being aesthetically reframed, not eliminated.
Section 5: Self-Improvement and Survival Are Statistically Entangled
5.1 Short Summary
The social graph does not show two audiences—“self-optimizers” and “strugglers.” It shows one audience living both realities at once.
5.2 Hypothesis
If affordability pressure is pervasive, then self-improvement behavior should co-occur with cost-driven compromise rather than separating into different populations.
5.3 Evidence and Analysis
Home cooking interests positively correlate with ultra-processed food consumption—suggesting people follow “better choices” while living inside constraint-driven decisions.
[Table 8: Home Cooking Audience Correlations]
| idx | cat1 | cat2 | network | corr_cats |
|---|---|---|---|---|
| 210 | Home cooking | Ultra-processed food | 0.094188 | |
| 10 | Home cooking | Luxury Fashion | 0.073308 | |
| 287 | Home cooking | BiggerPockets | 0.054174 | |
| 277 | Home cooking | VanLife/Nomad | 0.051601 | |
| 283 | Home cooking | Couponing | 0.051036 | |
| 285 | Home cooking | DIY repairs | 0.046601 | |
| 286 | Home cooking | Credit repair | 0.044945 | |
| 305 | Home cooking | Meal prep | 0.043817 | |
| 30 | Home cooking | Thrift/Secondhand | 0.031070 |
Key finding:
- Home cooking ↔ Ultra-processed food: 0.094 (strongest correlation for Home cooking)
Description:
This co-occurrence signals a single behavioral reality: Americans consume the language of self-improvement while practicing economic survival.
5.4 Interpretation
Affordability pressure is not experienced as collapse. It is experienced as continuous negotiation.
Section 6: Deep Dive — The Rental Overlapping Buying House Segment
6.1 Short Summary
This segment represents the purest affordability tension: people who rent while actively trying to buy.
6.2 Why This Segment Matters
They are neither “just renters” nor “successful buyers.” For this group, affordability is daily and concrete—studied, planned for, and deferred.
6.3 Evidence and Analysis
Method: Age index analysis for three housing groups: Buying house, Rental, House sharing.
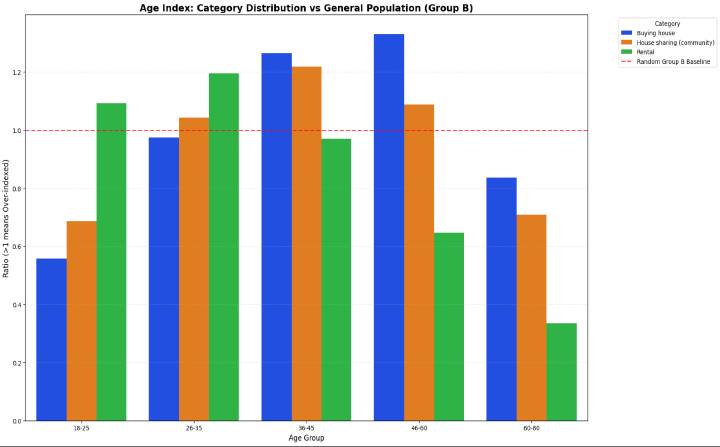
[Picture 2: Age Index for Three Housing Groups]
Key findings:
- Rental peaks 26–35 (~1.2), then declines sharply after 45
- Buying house peaks 46–60 (~1.32), stays elevated at 36–45 (~1.26)
- House sharing peaks 36–45 (~1.22), remains above baseline at 46–60 (~1.09)
- All groups under-indexed for 18–25
Interpretation:
Rental is a young person’s reality; buying is a midlife aspiration; house sharing bridges the gap for ages 36–45.
Structural overlap evidence:
[Table 9: Housing Categories Correlation Matrix]
| idx | cat1 | cat2 | network | corr_cats |
|---|---|---|---|---|
| 0 | Buying house | Rental | 0.014071 | |
| 1 | Buying house | House sharing (community) | 0.004733 | |
| 2 | House sharing (community) | Rental | 0.007945 |
- Buying house ↔ Rental: 0.014 (strongest link)
- House sharing ↔ Rental: 0.008
- Buying house ↔ House sharing: 0.005
This suggests continuum behavior, not separate populations.
Buying house to Rental correlation confirms state-to-state transition, not separate populations. House sharing sits between them as an intermediary strategy.
[Table 10: Top Interests in Rental overlapping Buying House Segment]
| idx | interest | perc |
|---|---|---|
| 4 | Apartment living | 0.537971 |
| 14 | Home Builders | 0.390555 |
| 5 | Apartment locating | 0.363114 |
| 26 | Mortgage lending | 0.165922 |
| 12 | Entrepreneurship | 0.103382 |
| 23 | Miami real estate | 0.081685 |
| 25 | Mortgage brokerage | 0.077218 |
| 32 | Real estate services | 0.059987 |
| 11 | Construction services | 0.048500 |
| 0 | Affordable homes | 0.044671 |
Top interests in Rental overlapping Buying House Segment:
- Apartment living (53.8%)
- Home Builders (39.1%)
- Apartment locating (36.3%)
- Mortgage lending (16.6%)
- Mortgage brokerage (7.7%)
- Affordable homes (4.5%)
6.4 Interpretation
Ownership aspiration is constrained by entry barriers. Mortgages are studied more than executed. The dream persists, but the system slows it.
Section 7: Graph Analysis — Housing Interest Clusters and Intersections
7.1 Short Summary
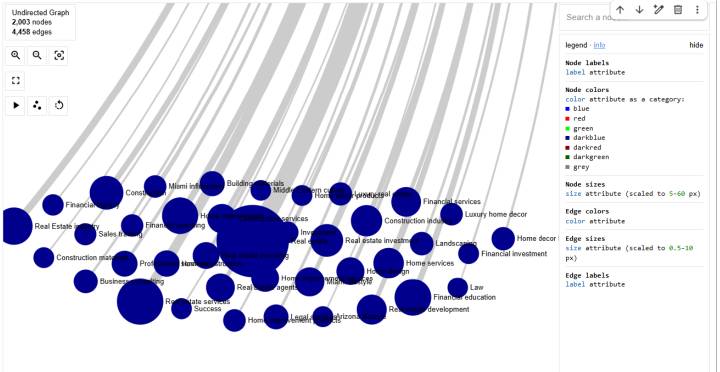
The social graph visualization (2,003 nodes, 4,458 edges) reveals three core housing-related groups structuring affordability behavior: Buying House, Rental, and House Sharing.
Method: Social graph analysis of Instagram audiences. Nodes are interest categories; edges represent correlations; node color indicates strongest housing association; grey zones indicate overlap.
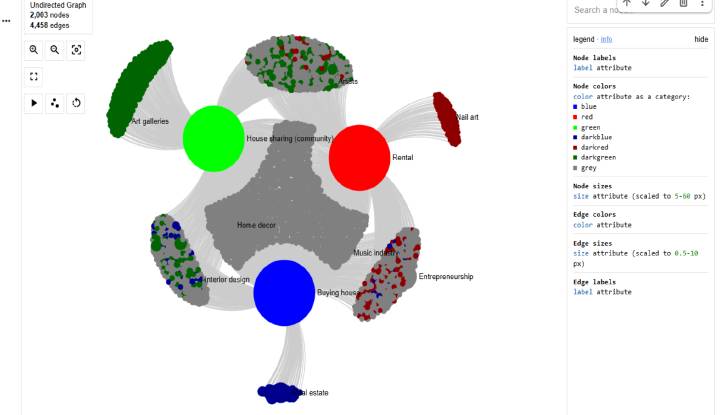
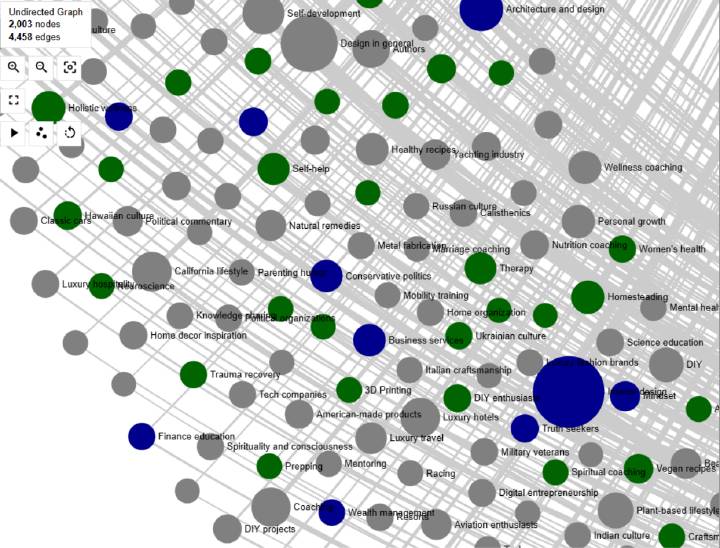
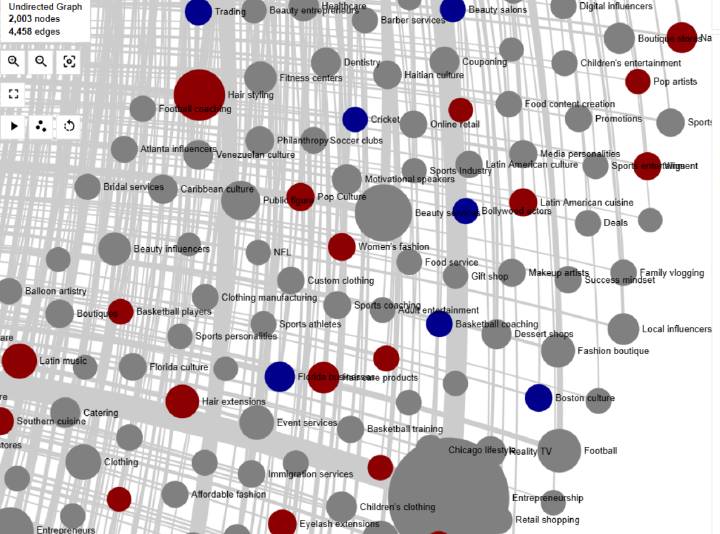
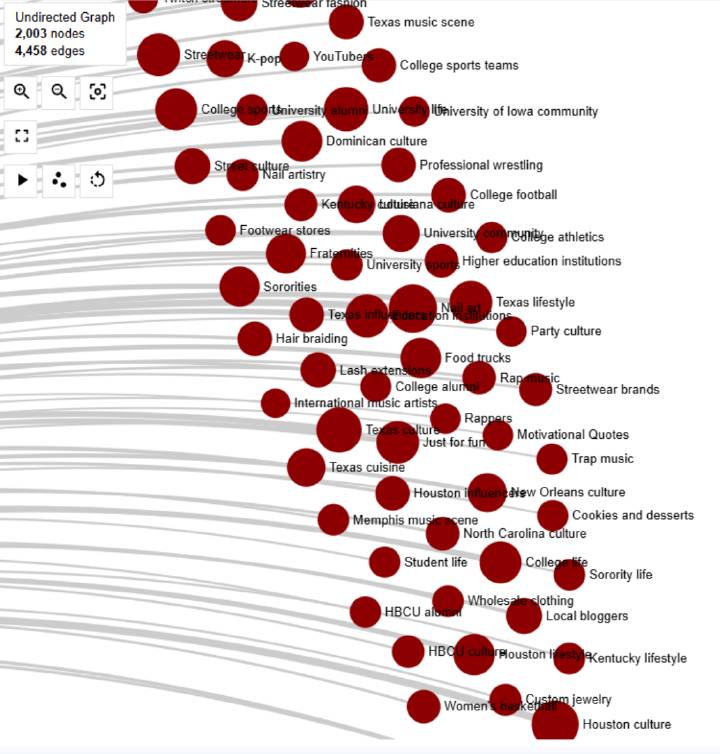
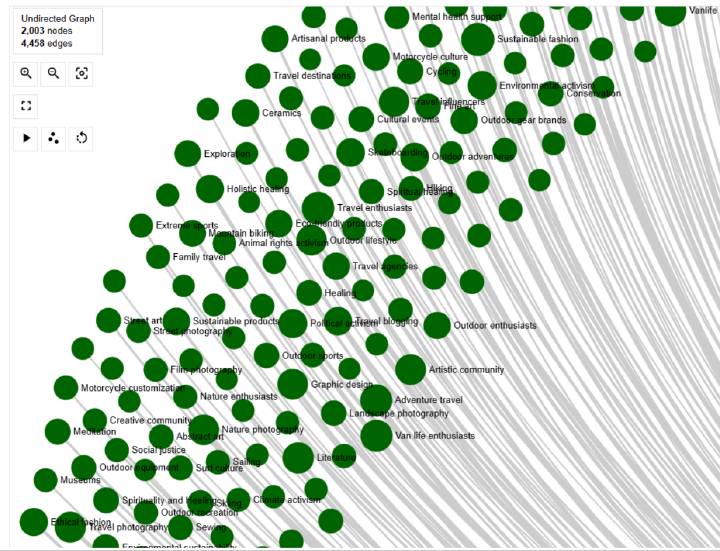
[Picture 3: Full Interest Graph — Three Housing Groups and Their Interests]
Description:
Undirected graph with 2,003 nodes and 4,458 edges showing interest clusters around three main housing nodes:
- Buying house (large blue node, bottom center) - surrounded by blue/darkblue interests
- Rental (large red node, right side) - surrounded by red/darkred interests
- House sharing (large green node, upper left) - surrounded by green/darkgreen interests
- Grey clusters in the center represent shared interests (Home decor, Interior design, Entrepreneurship, Music industry)
Visual structure:
- Three distinct “lobes” emanate from the center, each dominated by one housing group
- Art galleries, Artists cluster near House sharing (creative, alternative lifestyle)
- Nail art, youth culture interests cluster near Rental (younger demographic)
- Real estate, financial interests cluster near Buying house (investment-oriented)
- The grey mass in the center shows interests shared across all groups - aspirational interests that transcend housing status
Audience portraits derived from the graph:
- Buying house audience: financially focused, investment-minded, interested in real estate education, home improvement, and wealth building
- Rental audience: younger, culturally distinct, regionally concentrated (Texas, Southern culture), interested in streetwear, food, and entertainment
- House sharing audience: mobility-oriented, creative, interested in art, travel, sustainability, and alternative lifestyles
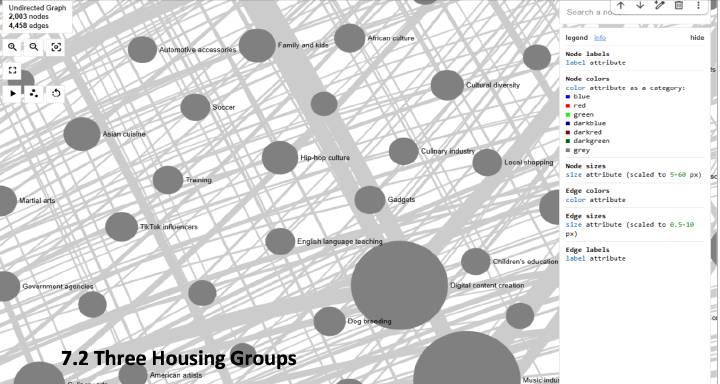
7.2 Three Housing Groups
- Buying House (Blue) — active purchasers and aspirants
- Rental (Red) — renter-dominant audiences
- House Sharing (Green) — alternative housing strategy adopters
7.3 Cluster Patterns
Blue (Buying House):
Financial services, real estate investment, construction, mortgage lending, home builders, luxury decor.
Red (Rental):
Youth lifestyle, regional culture, streetwear, food, entertainment.
Green (House Sharing):
Travel, sustainability, vanlife, minimalism, outdoor lifestyle.
Grey zones (shared):
Interior design, home décor, entrepreneurship, music industry—aspirations that persist across housing status.
7.4 Conclusion
Housing is not clean segmentation. People move between rental, ownership aspiration, and alternatives—often simultaneously. Affordability does not create separate tribes. It creates a shared field of constrained choices with different coping strategies.
Executive Takeaway
This is not a story of the poor versus the wealthy. It is the story of a middle class caught between promised upward mobility and structural limits—navigating credit systems, housing barriers, and everyday compromises.
Affordability is not only a financial condition. In this data, it emerges as a behavioral system: credit recovery, optimization, and adaptation—stacked across the same people over time.